
Instagram Travel Hacks and Home Storage Reels Reach Up to 50 Million Views
Our latest data shows how utility-focused reels and extreme outliers are driving the highest view counts on Instagram across six major niches.

A single travel reel gained 50 million views this week, showing how extreme outliers pull up niche averages on Instagram. While the travel niche averaged 1.2 million views per post, most creators saw far lower reach. To understand these patterns, we analyzed 404 public posts across six distinct niches using ContentScout, a social data platform that turns public metrics into actionable content signals. Our dataset spans Fitness, Travel, Food, Home, Fashion, and Beauty, exposing a stark contrast between massive viral reach and actual user engagement.
Fitness & Wellness
Fitness and wellness posts had the highest average at 1.4 million views, but this number is heavily skewed by a single creator. Several creators dominate the top spots in fitness, where @dickersonross generated 55 million total views across his content, while the median engagement rate for the 69 sampled fitness posts sat at 2.95 percent. The high engagement rate indicates that fitness audiences are highly interactive compared to other categories, even when individual view counts remain modest.

The most successful post focused on a quick six-minute routine that required no gym equipment. This video by @demicstory achieved 777,000 views, which is actually lower than the category's overall average view count. This gap shows that a few massive accounts pull the entire category upward. Viewers are clearly interested in home workouts that do not require expensive equipment or memberships.
Hashtags in this space also point to home workouts. The hashtag #homeexercises averaged 28 million views, which was much higher than #gym at 4.8 million views or #workoutroutine at 4.6 million views. The massive view count for #homeexercises demonstrates that convenience is the main driver of fitness discovery on the platform. Interestingly, the hashtag #funny also showed up in this category with 5.4 million average views, while #muscle was much lower at 2.3 million views. This tells us that entertaining fitness content performs better than technical bodybuilding posts.
Music choices in this niche were repetitive. "B's On The Table" by Drake and 21 Savage and "This & That" by Stray Kids both appeared twice in the sample, while "Still D.R.E. (Instrumental)" by Dr. Dre appeared once. Other top creators in this space pulled substantial numbers. For example, @alex.olarte reached 13 million total views, and @vallitfit reached 11 million total views. These creators achieve broad reach by focusing on content that appeals to general audiences.
Travel
Travel posts came in second with an average of 1.2 million views across 69 sampled posts, but their median engagement rate was lower at 2.52 percent. This niche is where the single largest outlier of the week appeared, which heavily impacted the overall average.
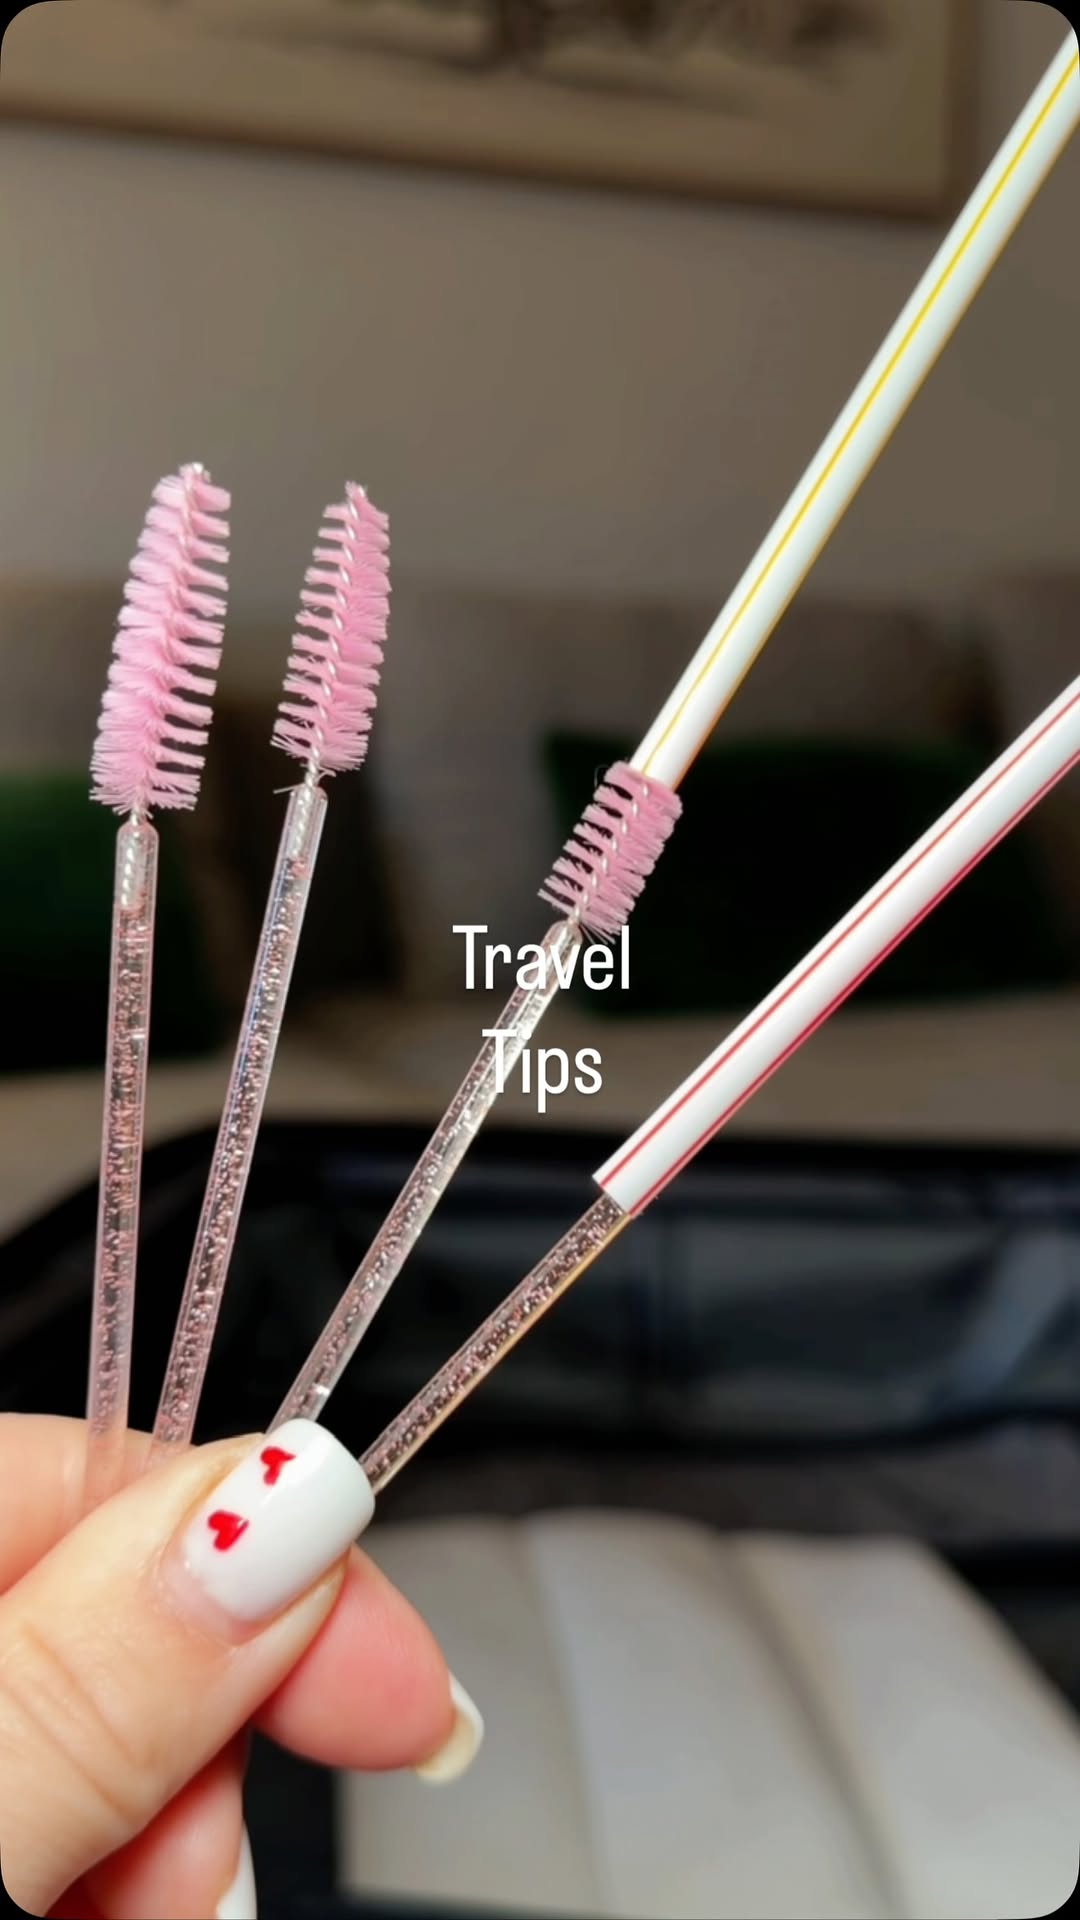
The video showed specific space-saving packing methods and quick life hacks. This post by @ira.motherhood reached 50 million views. It was the most watched post in the entire dataset. Instagram travel posts show a clear preference for utility over inspiration, with practical tips getting more attention than scenic views. Viewers are saving and sharing packing tips rather than just looking at pretty destinations.
The hashtag data supports this focus on utility. General tags like #hack and #usefultips both averaged 26 million views, while #lifehack averaged 25 million views. In comparison, niche-specific tags like #travelhacks averaged 10 million views, and #tutorial averaged 6.7 million views. This massive difference in view counts suggests that broad, generic productivity hashtags are much more effective at reaching general audiences than specific travel tags.
Other travel creators also gained significant reach. For instance, @northernelg reached 8.7 million total views, and @goanniewhere reached 5.5 million total views. The audio track "Raindance" by Dave and Tems appeared in 3 different posts in this niche, while "Makeba (Ian Asher Remix)" and "Ilahi" by Arijit Singh each appeared in 1 post. This highlights a trend toward upbeat, rhythmic music for fast-paced travel tips.
Food & Recipes
The food and recipes category sat in the middle of the ranking with 680,000 average views across 68 sampled posts and a median engagement rate of 2.56 percent. This niche shows a close alignment between average views and the performance of top posts, meaning reach is more predictable here than in travel or fitness.
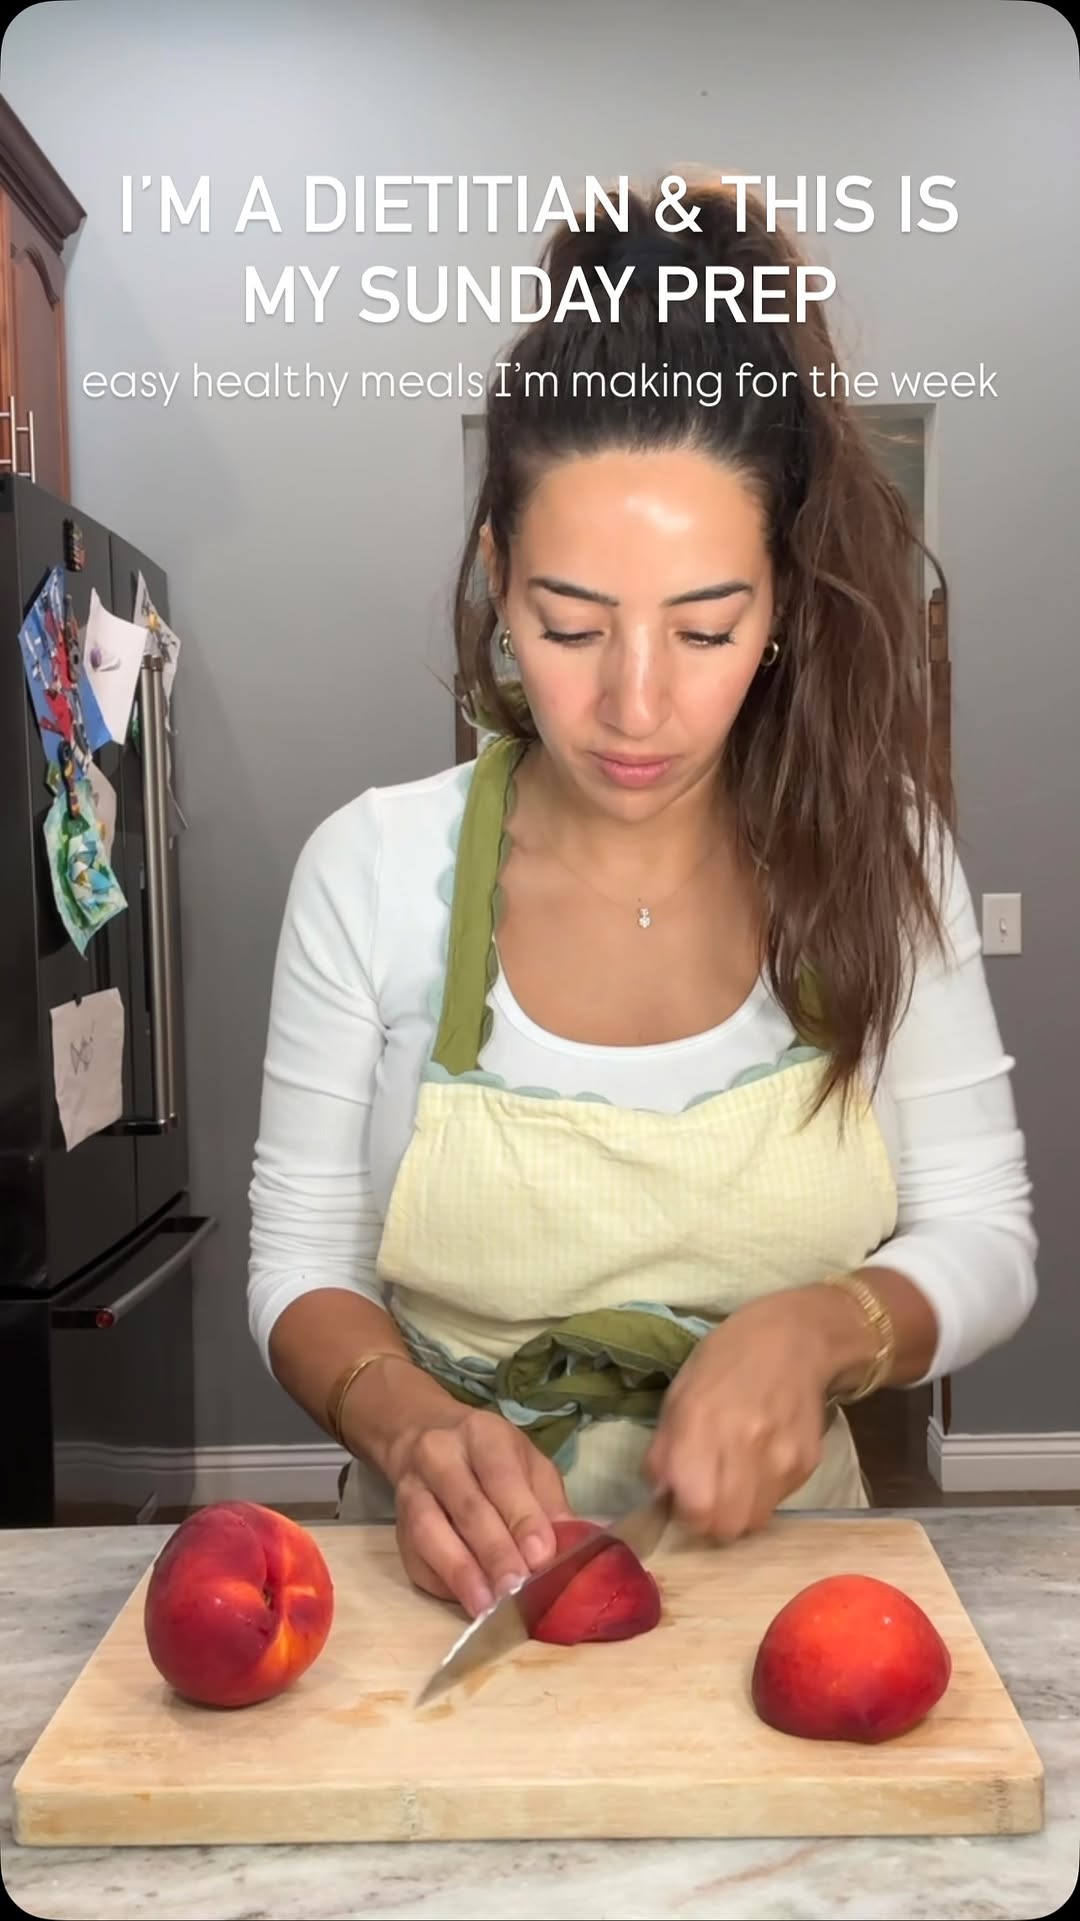
This post utilized a consistent Sunday upload schedule to build a dedicated viewer base. The creator, @momnutritionist, hit 490,000 views on this specific reel and gained 8.1 million total views across the week. By focusing on meal prep routines, the creator addresses a recurring weekly need for busy people.
Interestingly, fitness and weight loss hashtags dominated this category. The most popular food hashtags on Instagram were actually #fatloss and #fitness, which both averaged 5.6 million views. These were followed by #highprotein and #healthymeals, which both averaged 4.4 million views, while #healthyrecipes averaged 2.4 million views. This crossover tells us that viewers look at food content primarily through a health and weight loss lens, rather than just culinary skill.
The top creator in this niche was @jalalsamfit, who reached 11 million total views, followed by @foodie_gujarati11 with 4.6 million total views. Our sample did not capture any recurring audio tracks for this niche. This gap suggests that food creators are using a highly fragmented selection of sounds or relying entirely on original voiceovers to explain their recipes.
Home & Interiors
Home and interiors posts averaged 472,000 views across 69 sampled posts with a median engagement rate of 2.98 percent. This is the highest engagement rate among all six categories we analyzed. It shows that although the home niche has a smaller overall audience than fitness or travel, those viewers are much more likely to comment, like, and share.

This post succeeded because it showed how to get more storage in small spaces. The reel by @mk.craft_house achieved 14 million views, which accounted for almost all of that creator's total weekly views of 14 million. The popularity of this post shows a strong market demand for practical spatial solutions rather than high-end, expensive luxury designs.
Many home decor accounts focus on practical layouts, as shown by the hashtag performance. The hashtag #moderninteriordesign led with 7 million average views, but functional tags also performed well. For example, #organizationtips had 1.8 million average views, #storagesolutions had 1.2 million average views, and #smallspaceliving had 932,000 average views, while #livingroom had 1.2 million average views.
Other creators who pulled large numbers include @nikl0w with 3.6 million total views and @designsbyashleyknie with 3.2 million total views. The audio tracks used were highly diverse. Tracks like "Vintage" by Cort, "Folded" by Kehlani, and "Last Train to London" by Rikas each appeared just once in the sample, which indicates that music choice is not a major factor in this category.
Fashion
Fashion was the second lowest performing category this week, with an average of 319,000 views across 64 posts and a median engagement rate of 2.84 percent. Unlike other niches where one video dominated everything, fashion reach was more evenly distributed among top creators.

This post relied on a simple style display rather than heavy editing. The creator @diasdechuvaseca reached 434,000 views with this reel, focusing on an emotional hook about love and happiness. This shows that relational or uplifting captions can sometimes boost simple fashion displays.
Fashion hashtags show what viewers search for, with #howtostyle leading at 3 million average views. Other top tags included #styleinspiration at 2.3 million views, #outfits at 1.5 million views, #outfitinspo at 511,000 views, and #fashionreels at 499,000 views. The high view count for #howtostyle confirms that fashion viewers are looking for instructional guides on how to wear specific items.
The top overall fashion creator by total reach was @jeanwang, who pulled in 7.9 million total views, followed by @ronhiree with 4.6 million views and @stylecadenza with 3.8 million views. The most common audio track was "Last Train to London" by Rikas, which appeared in 2 posts. Other tracks like "Circles" by Post Malone and "Back To Black" by Amy Winehouse each appeared once.
Beauty & Skincare
Beauty and skincare sat at the bottom of the rankings this week. The category had an average of 301,000 views across 65 posts and the lowest median engagement rate in our sample at 2.20 percent. This suggests that the beauty space on Instagram is highly saturated and struggles to hold active viewer attention.

The video was a step-by-step tutorial that listed specific product names in the description. The post by @afiyabennett reached 186,000 views, which is low compared to top posts in other categories. Top beauty posts on Instagram focused on educational content rather than pure transformation.
The hashtag performance shows a clear division between skincare and makeup. The hashtags #dermatologist and #skincaretips both averaged 635,000 views, which was higher than #skincareroutine at 361,000 views, #glassskin at 341,000 views, and #makeuphacks at 337,000 views. This tells us that clinical or professional skincare advice is currently more popular than cosmetic styling.
The leading creator in this niche was @ahnestkitchen with 4 million total views, followed by @tablemannerspodcast with 2.8 million views and @jillian.gottlieb with 1.9 million views. The audio selection was highly fragmented, and tracks like "All This And Heaven Too" by Jackie Gleason, "Nothin' on You" by B.o.B, and "we can't be friends" by Ariana Grande appeared only once.
Next week, test using highly practical, utility-driven angles like space-saving hacks or step-by-step tutorial formats in your reels, as these specific formats generated the highest view counts across multiple categories in this dataset.