
Top Fitness and Wellness Hashtags on TikTok
This week, we sampled 166 public Fitness and Wellness posts on TikTok. The average view count across these posts is 3,039,289 with a median engagement rate of 10.99 percent. ContentScout ranks the top hashtags below based on internal scoring.
ContentScout's own analysis: we sample real public posts matching fitness & wellness search terms on TikTok and score them by how much engagement they're getting relative to how recently they were posted. Hashtags are ranked by the average views of the posts using them, not by how often they appear. The numbers describe those posts, they don't promise results.
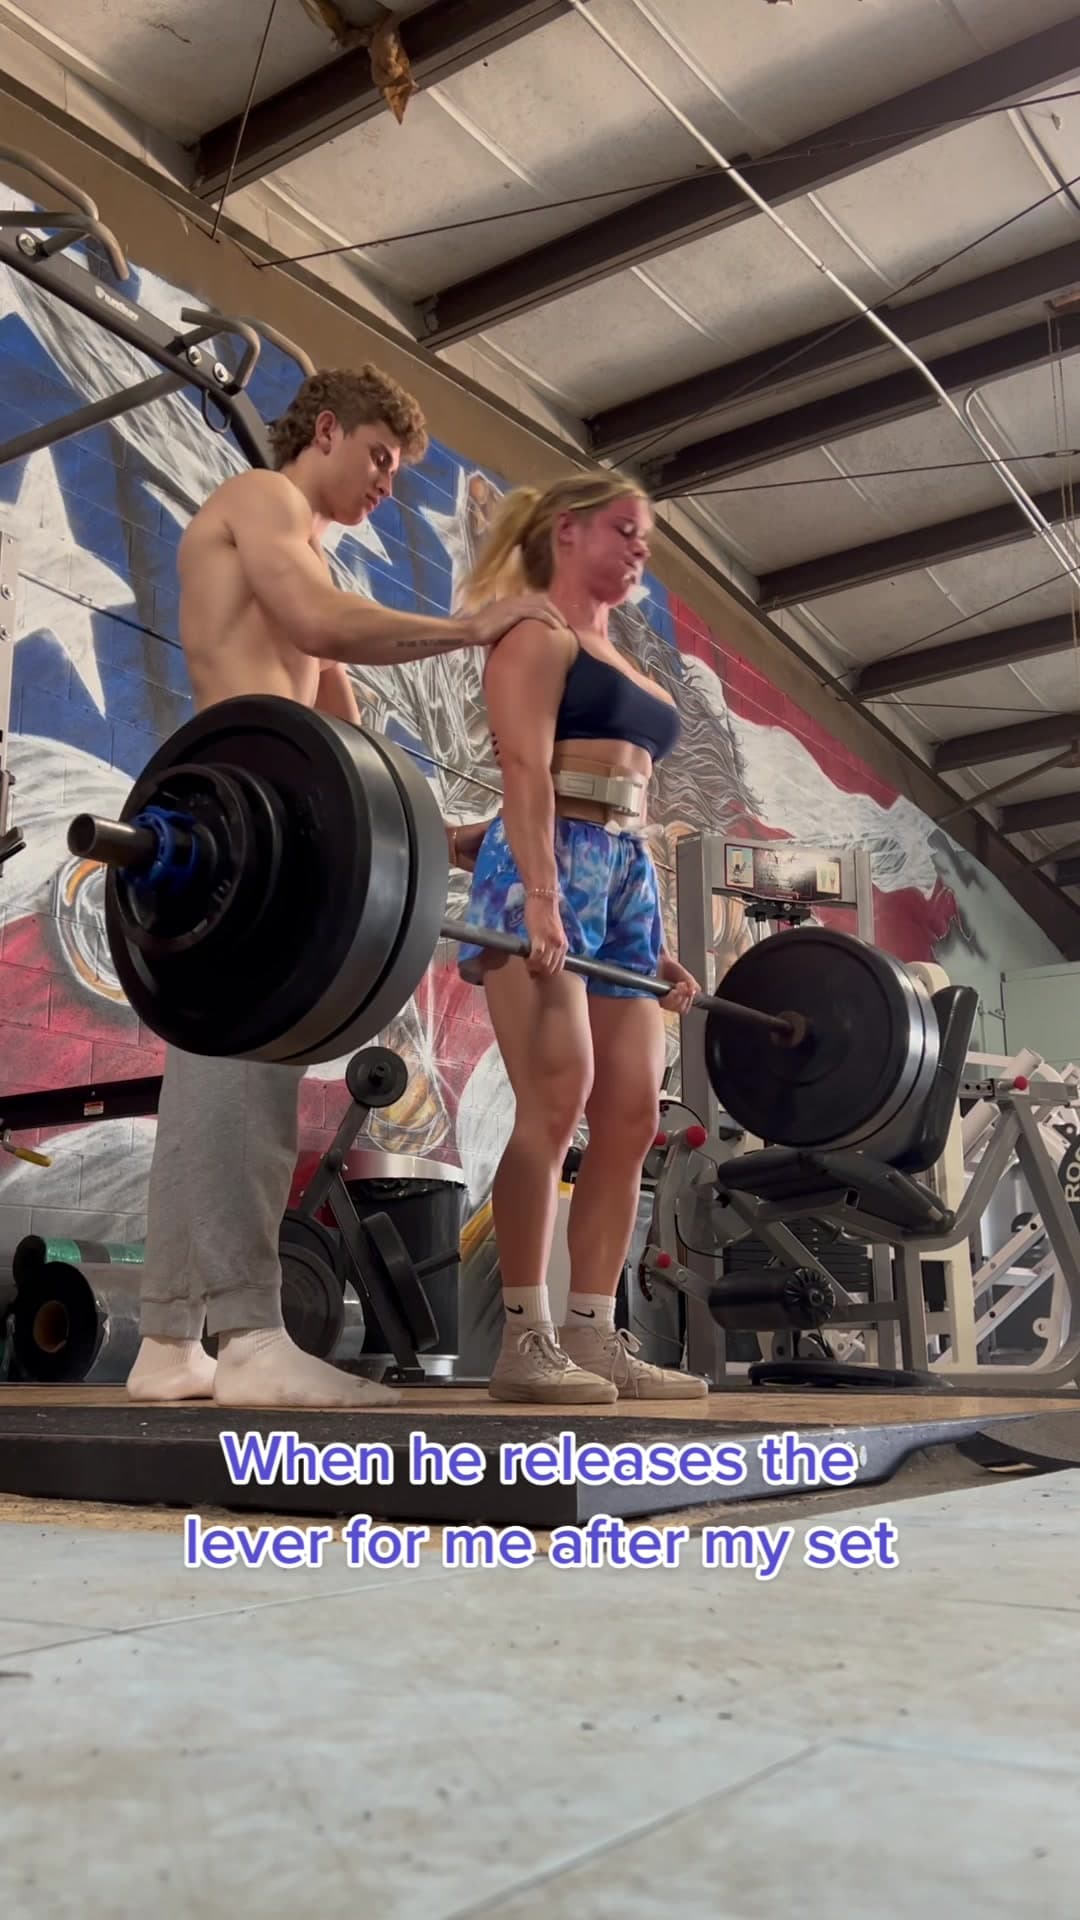
#fittok
5 posts in sample
- 17M
- Avg. views
- 16.6%
- Engagement
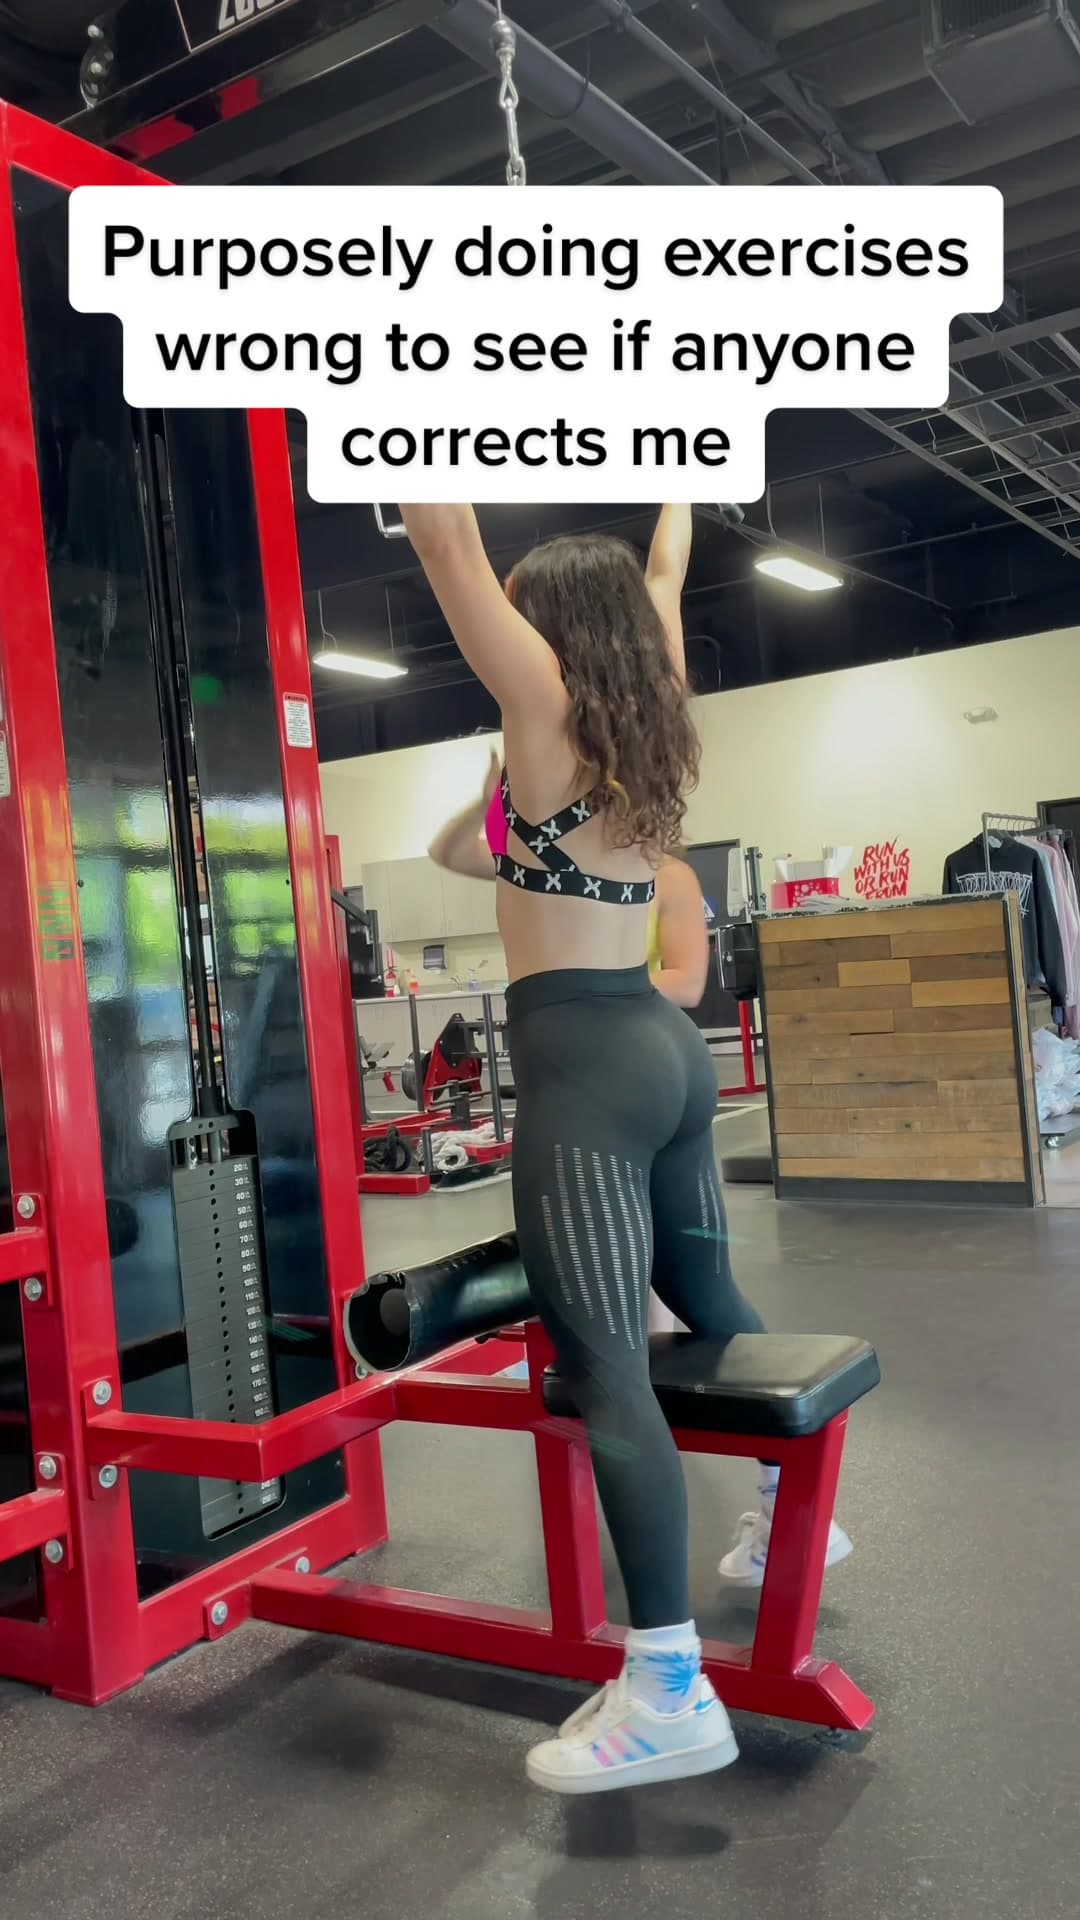
#pranks
2 posts in sample
- 16M
- Avg. views
- 13.8%
- Engagement
#gympranks
2 posts in sample
- 16M
- Avg. views
- 13.8%
- Engagement
#gymprank
2 posts in sample
- 16M
- Avg. views
- 13.8%
- Engagement
#zooculture
2 posts in sample
- 16M
- Avg. views
- 13.8%
- Engagement

#chest
2 posts in sample
- 16M
- Avg. views
- 17.0%
- Engagement
#triceps
2 posts in sample
- 16M
- Avg. views
- 17.0%
- Engagement
#prank
3 posts in sample
- 15M
- Avg. views
- 15.1%
- Engagement
#gymcomedy
3 posts in sample
- 15M
- Avg. views
- 15.1%
- Engagement
#fitnesscomedy
3 posts in sample
- 15M
- Avg. views
- 15.1%
- Engagement
#fittiktok
3 posts in sample
- 15M
- Avg. views
- 15.1%
- Engagement
#fitgirl
3 posts in sample
- 15M
- Avg. views
- 15.1%
- Engagement
#girlsthatlift
3 posts in sample
- 15M
- Avg. views
- 15.1%
- Engagement
#tamil
2 posts in sample
- 15M
- Avg. views
- 20.3%
- Engagement
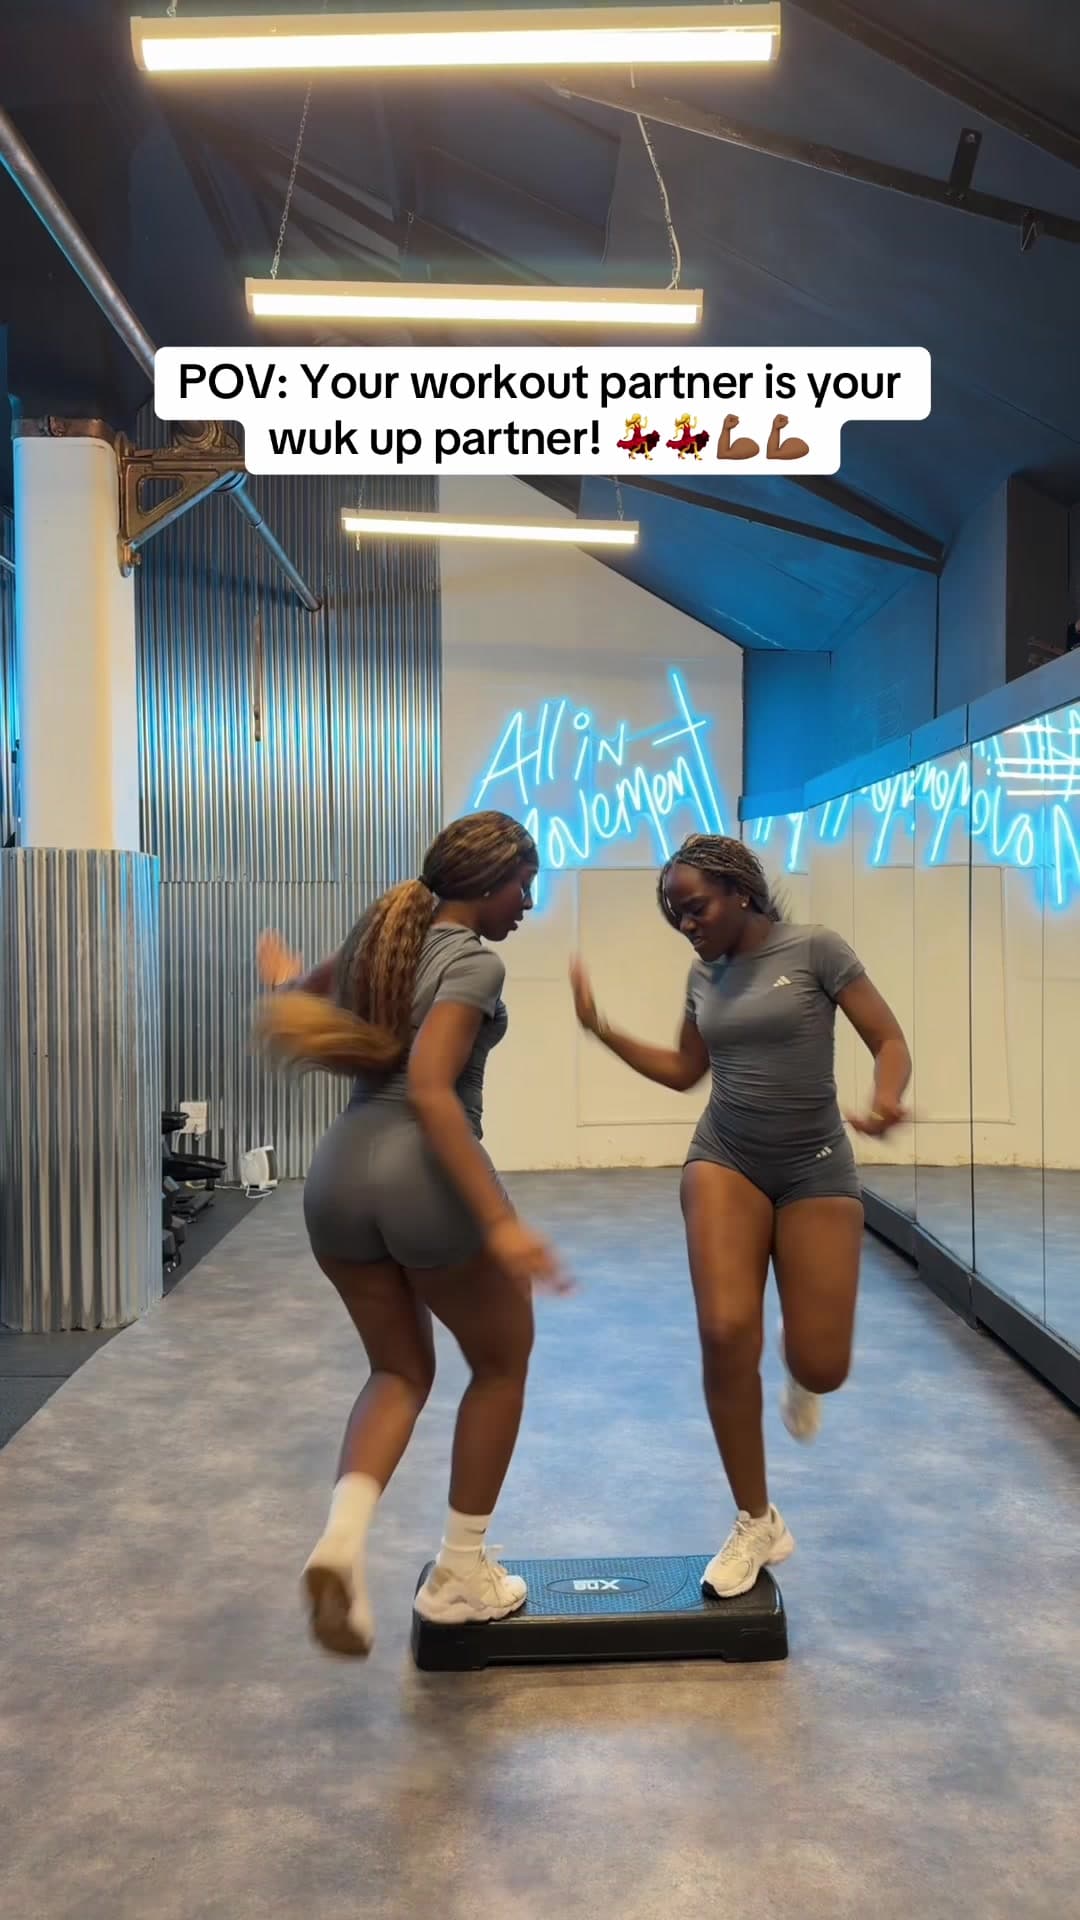
#fitnesstok
19 posts in sample
- 14M
- Avg. views
- 15.4%
- Engagement
#fitnesstiktok
4 posts in sample
- 12M
- Avg. views
- 15.8%
- Engagement
#gymtiktok
4 posts in sample
- 12M
- Avg. views
- 15.8%
- Engagement
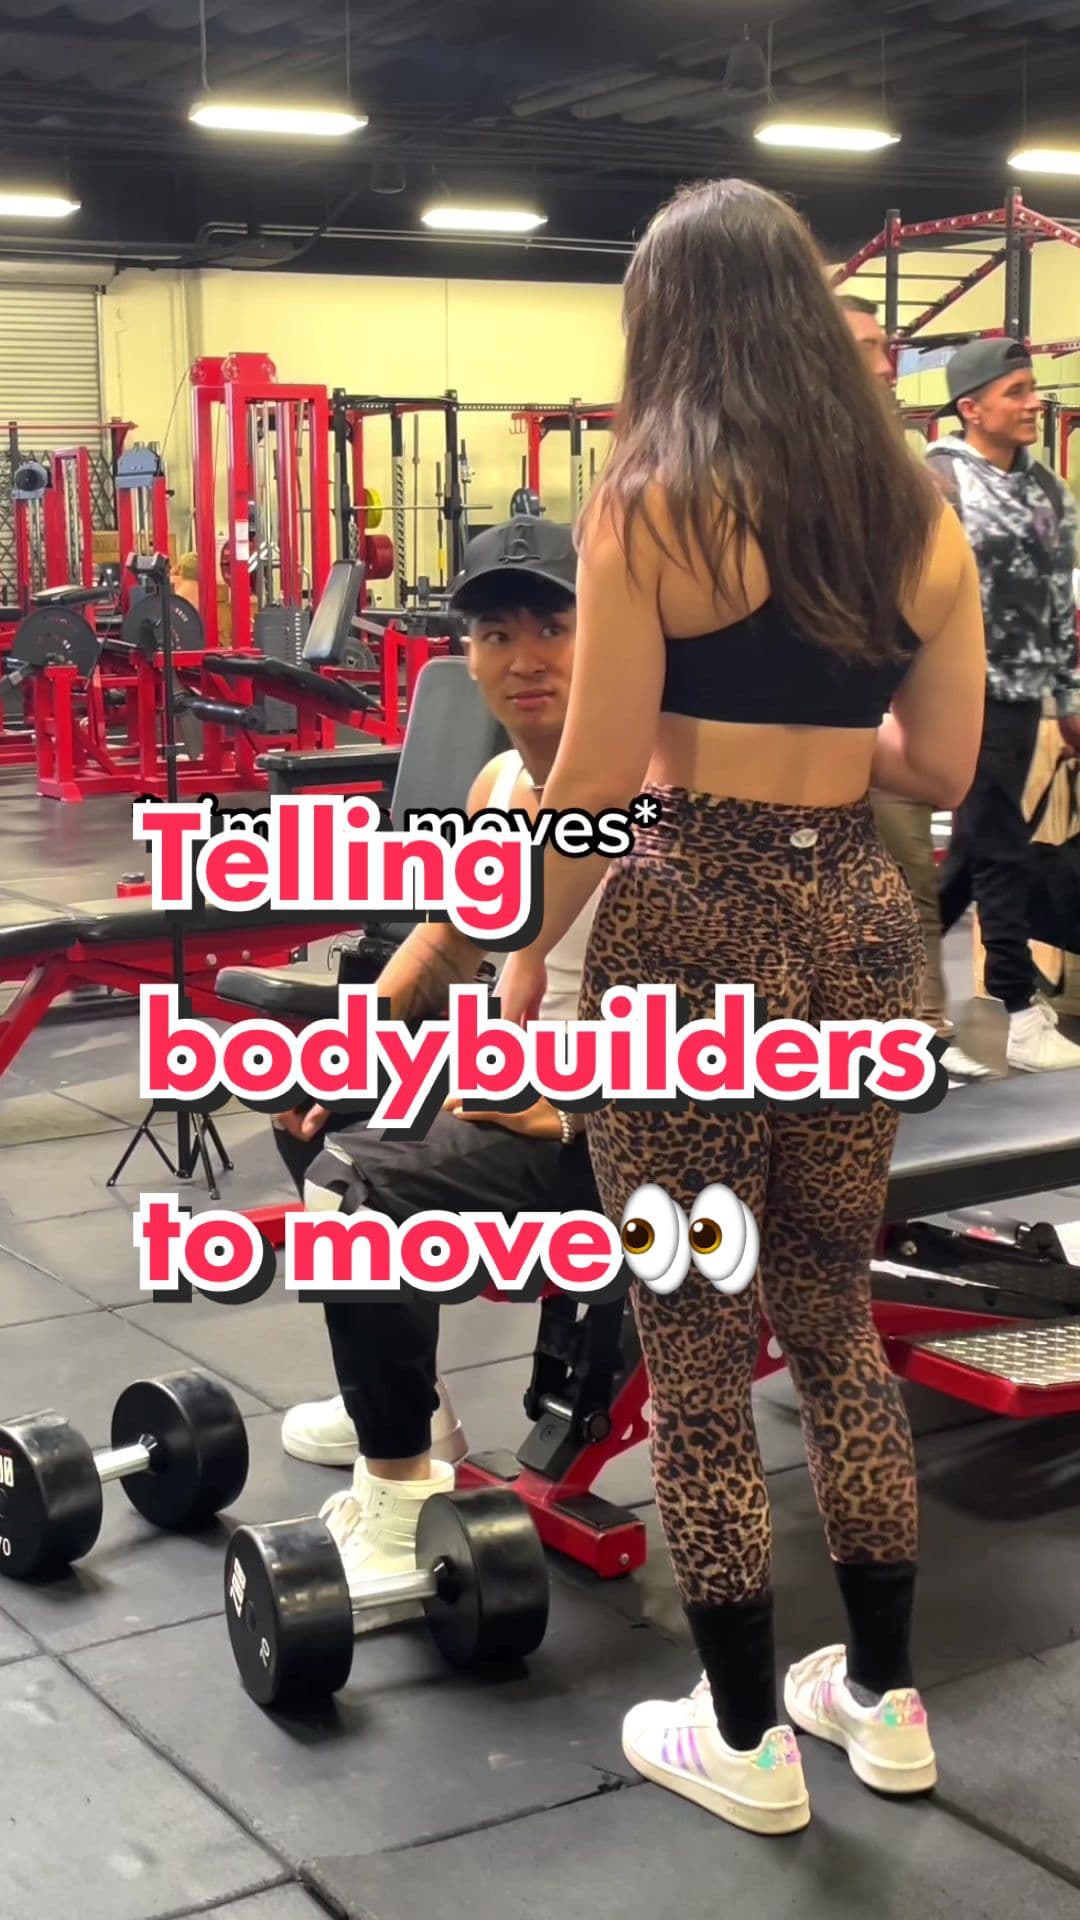
#bodybuilderprank
2 posts in sample
- 11M
- Avg. views
- 14.5%
- Engagement
#bodybuildingprank
2 posts in sample
- 11M
- Avg. views
- 14.5%
- Engagement
#fitnesshumor
2 posts in sample
- 11M
- Avg. views
- 14.5%
- Engagement
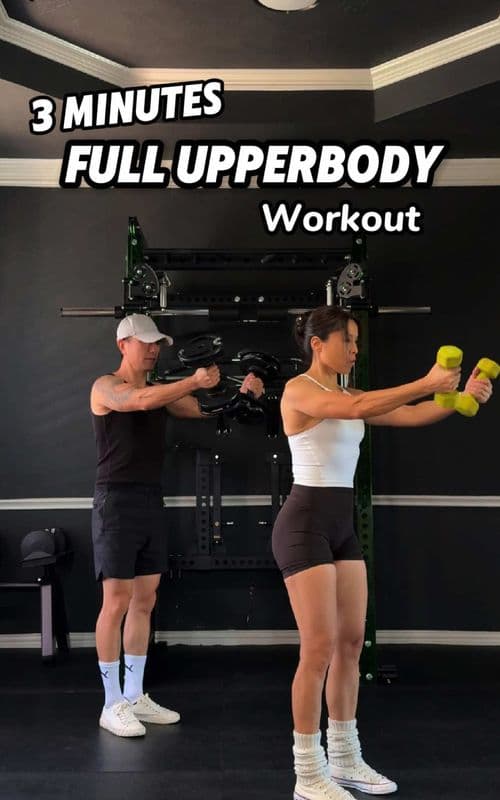
#shoulders
3 posts in sample
- 11M
- Avg. views
- 11.9%
- Engagement
#core
2 posts in sample
- 10M
- Avg. views
- 17.3%
- Engagement

#wellness
2 posts in sample
- 10M
- Avg. views
- 5.8%
- Engagement
#pushups
2 posts in sample
- 9.7M
- Avg. views
- 21.8%
- Engagement
#consistency
2 posts in sample
- 9.7M
- Avg. views
- 19.4%
- Engagement
Questions, answered.
How is this data measured?+
ContentScout reads social data from public posts. This week's sample includes 166 Fitness and Wellness posts on TikTok.
What are the top-performing hashtags right now?+
#fittok leads the ranking, appearing on 5 posts with an average of 16,787,503 views and a 16.56 percent median engagement rate. #fitnesstok appears on 19 posts with an average of 14,360,377 views.
Should I use all of these hashtags on every post?+
No. The data shows how specific tags perform across different posts, not a requirement to combine them all.
Do these view numbers guarantee my results?+
No. A hashtag's average views describe the posts using it in our sample, and do not guarantee your own reach.
More on Fitness & Wellness on TikTok