
Top Travel Hashtags on TikTok Right Now
This week, 164 public TikTok posts in the travel niche have an average of 1456129 views and a median engagement rate of 7.09%. Average views rose from 713988 in the previous run. ContentScout ranks the best-performing hashtags below based on these public posts.
ContentScout's own analysis: we sample real public posts matching travel search terms on TikTok and score them by how much engagement they're getting relative to how recently they were posted. Hashtags are ranked by the average views of the posts using them, not by how often they appear. The numbers describe those posts, they don't promise results.

#switzerland
2 posts in sample
- 13M
- Avg. views
- 15.5%
- Engagement

#travellife
3 posts in sample
- 9.8M
- Avg. views
- 5.7%
- Engagement
#swiss
3 posts in sample
- 9.7M
- Avg. views
- 11.3%
- Engagement

#airport
3 posts in sample
- 7.8M
- Avg. views
- 4.4%
- Engagement

#airplane
2 posts in sample
- 5M
- Avg. views
- 5.9%
- Engagement
#flights
2 posts in sample
- 5M
- Avg. views
- 5.9%
- Engagement

#italy
2 posts in sample
- 4.6M
- Avg. views
- 8.3%
- Engagement
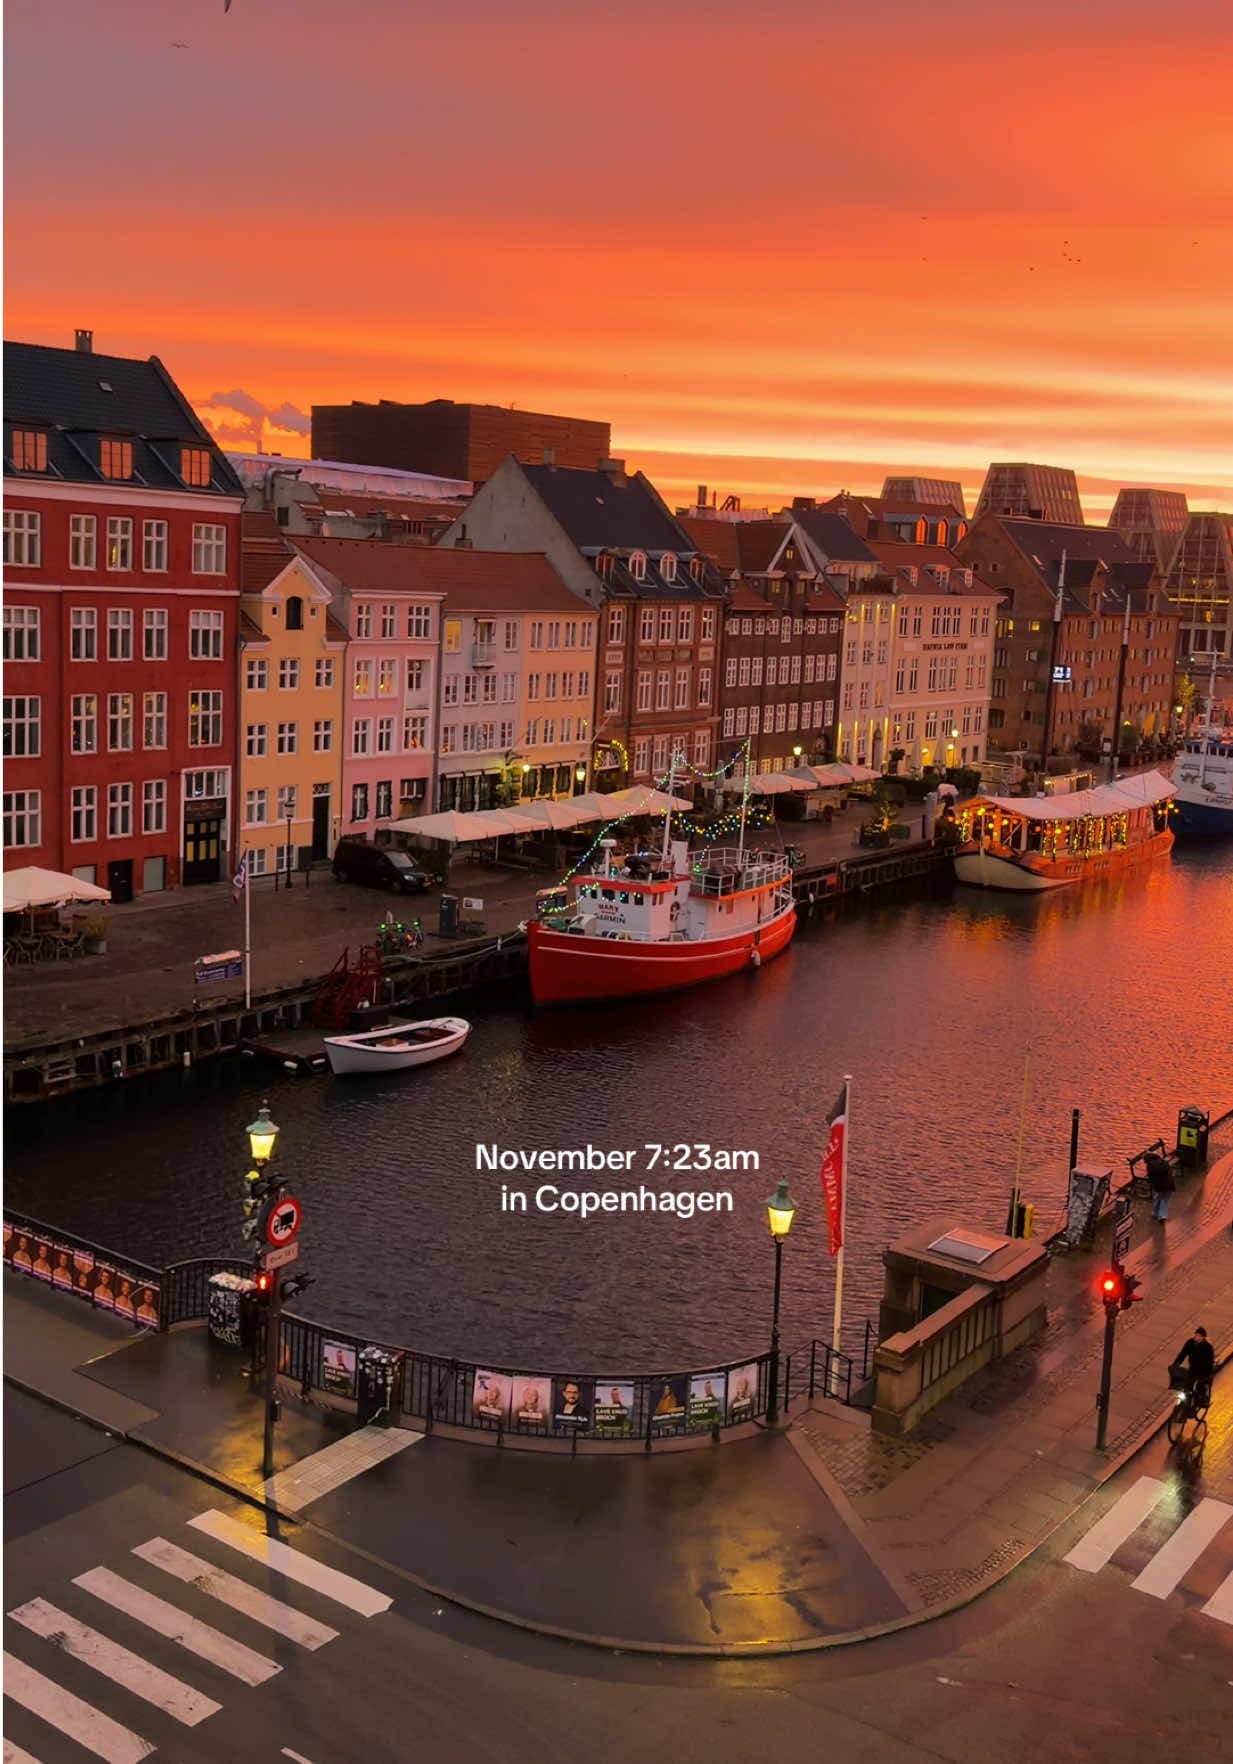
#hotel
2 posts in sample
- 4.4M
- Avg. views
- 16.4%
- Engagement

#hiking
3 posts in sample
- 4M
- Avg. views
- 9.7%
- Engagement

#nature
3 posts in sample
- 3.7M
- Avg. views
- 17.0%
- Engagement
#fyp
20 posts in sample
- 3.5M
- Avg. views
- 7.0%
- Engagement
#travelvlog
2 posts in sample
- 3.2M
- Avg. views
- 3.5%
- Engagement
#travel
52 posts in sample
- 3M
- Avg. views
- 8.9%
- Engagement
#traveltiktok
12 posts in sample
- 2.6M
- Avg. views
- 5.8%
- Engagement

#london
2 posts in sample
- 2.5M
- Avg. views
- 11.3%
- Engagement

#thailand
5 posts in sample
- 2.5M
- Avg. views
- 7.0%
- Engagement

#nyc
2 posts in sample
- 2.1M
- Avg. views
- 6.4%
- Engagement

#traveltok
34 posts in sample
- 1.9M
- Avg. views
- 6.6%
- Engagement

#traveladvice
2 posts in sample
- 1.8M
- Avg. views
- 3.3%
- Engagement
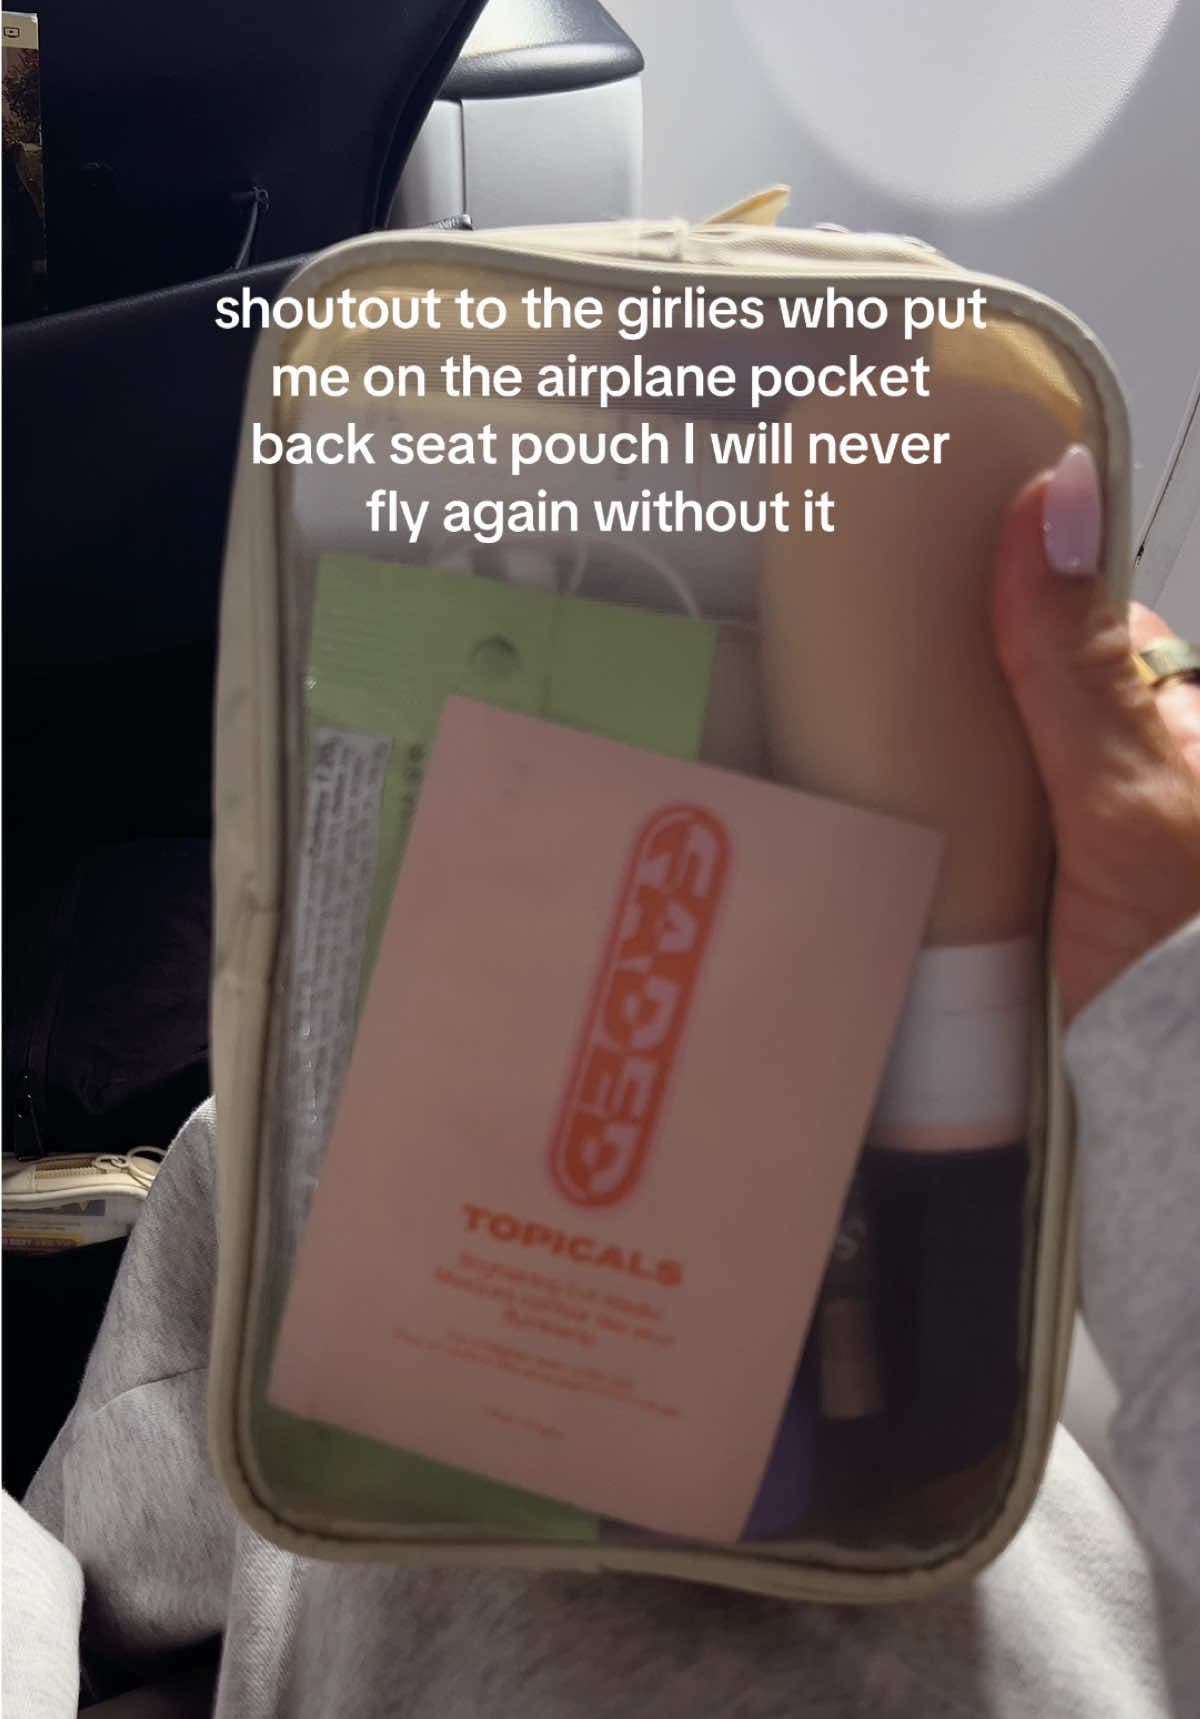
#travelhack
6 posts in sample
- 1.6M
- Avg. views
- 6.7%
- Engagement

#foryou
7 posts in sample
- 1.4M
- Avg. views
- 6.8%
- Engagement
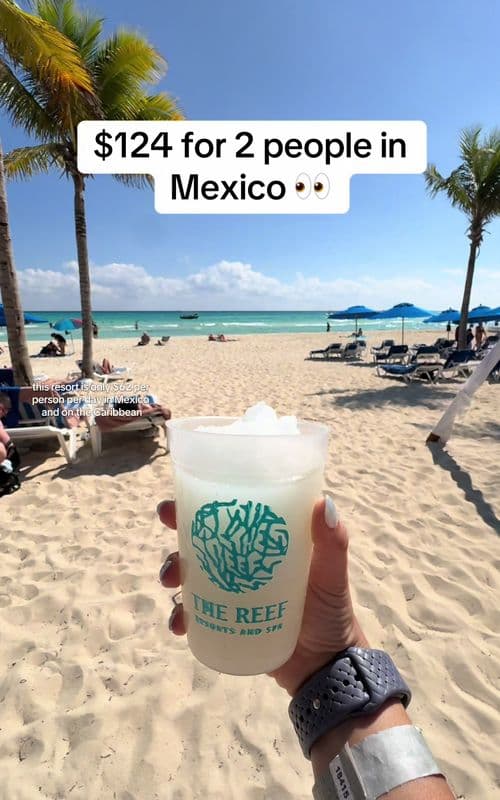
#tiktokgorisingstarsl2
2 posts in sample
- 1.3M
- Avg. views
- 3.0%
- Engagement
#playadelcarmen
2 posts in sample
- 1.3M
- Avg. views
- 3.0%
- Engagement
#allinclusive
2 posts in sample
- 1.3M
- Avg. views
- 3.0%
- Engagement
#mexicotravel
2 posts in sample
- 1.3M
- Avg. views
- 3.0%
- Engagement
Questions, answered.
How is this data measured?+
ContentScout samples real public posts in the travel niche each week. It reads social data from the platform and ranks hashtags by its own scoring system.
Which hashtag has the highest average views?+
#switzerland leads the ranking with an average of 13412931 views across 2 posts and a 15.53% median engagement rate.
Which hashtag appears on the most posts?+
#travel appears on 52 posts in the sample, holding an average of 2964916 views and an 8.88% median engagement rate.
Does using a hashtag guarantee a specific view count?+
No. A hashtag's average views describe the posts using it in our sample, and do not act as a guarantee for your own content.
More on Travel on TikTok